GitHub-Chart: Enhancing Your GitHub Contribution Graphs
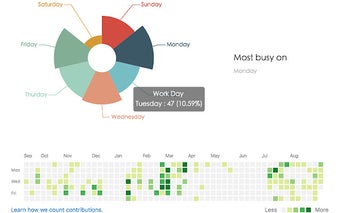
GitHub-Chart is a free Chrome extension developed by pdd that aims to improve the visualization of your GitHub contribution graphs. As an add-on tool for GitHub users, it enhances the way your commits are displayed by rendering bar graphs and pie graphs.
With GitHub-Chart, you can now easily analyze and interpret your contribution history on GitHub. The extension provides a fresh and visually appealing interface that presents your commits in a more comprehensive and intuitive manner. By utilizing bar graphs and pie graphs, GitHub-Chart allows you to gain a clearer understanding of your contribution patterns and trends.
This extension is a valuable tool for developers who want to track their progress, monitor their activity, and showcase their contributions on GitHub. Whether you are an individual developer or part of a team, GitHub-Chart offers a convenient way to visualize and share your commitment to open-source projects and collaborations.